IC Markets Home Sign in Web Trader Contact Us
IC Markets Social IC Markets Social

Information Hub for
Serious Traders

  • ABOUT US
  • OPEN LIVE ACCOUNT
  • OPEN DEMO ACCOUNT
  • TRADE NOW
  • VISIT OUR BLOG
IC Markets Social
  • ABOUT US
  • OPEN LIVE ACCOUNT
  • OPEN DEMO ACCOUNT
  • TRADE NOW
  • VISIT OUR BLOG
September 22, 2022North_American_Stocks_ptIC Markets

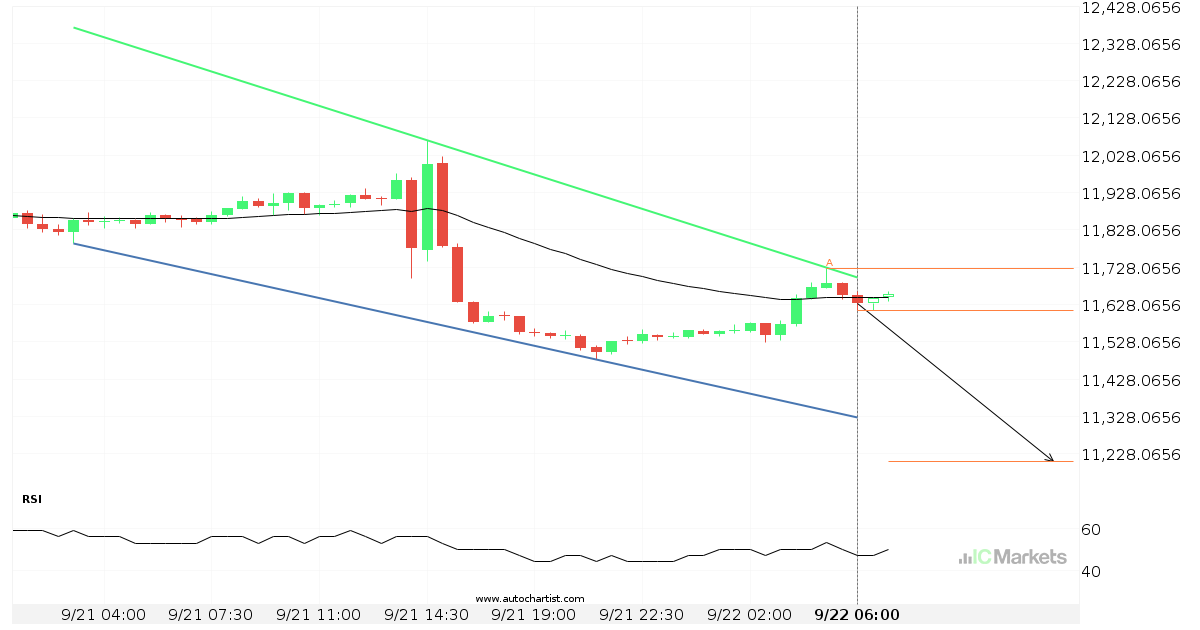
US Tech 100 Index approaching support of a Cunha descendente

US Tech 100 Index is approaching the support line of a Cunha descendente. It has touched this line numerous times in the last 2 days. If it tests this line again, it should do so in the next 7 hours.

Read more
September 21, 2022North_American_Stocks_ptIC Markets

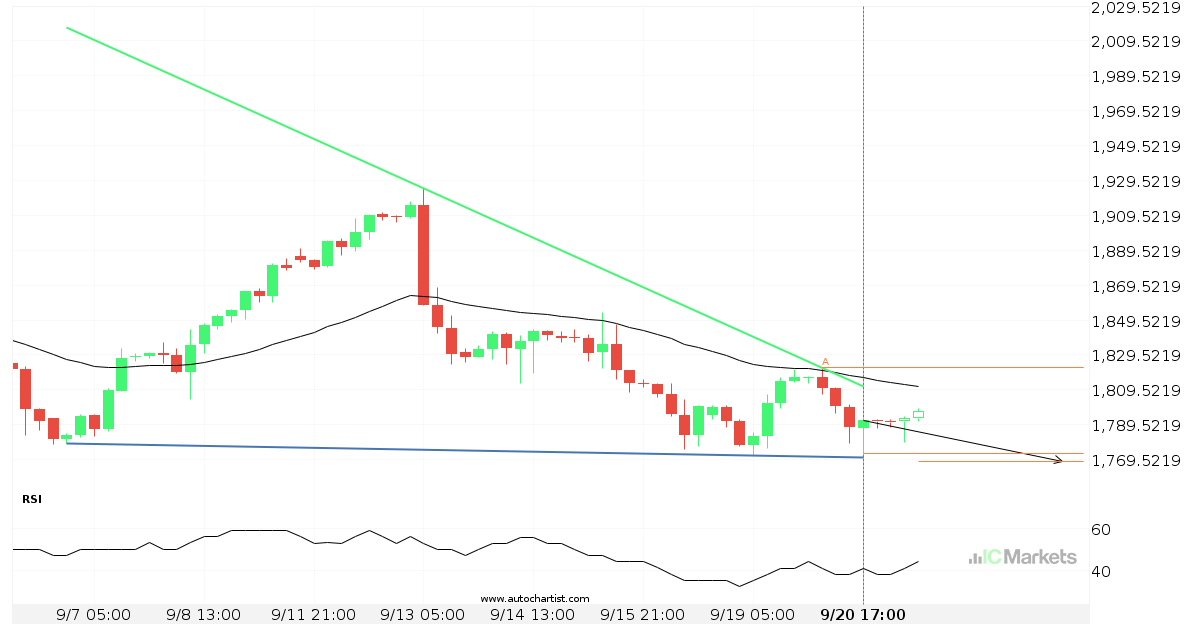
Will US Small Cap 2000 Index have enough momentum to break support?

US Small Cap 2000 Index is heading towards the support line of a Triângulo Descendente and could reach this point within the next 3 days. It has tested this line numerous times in the past, and this time could be no different from the past, ending in a rebound instead of a breakout. If the […]

Read more
September 20, 2022North_American_Stocks_ptIC Markets

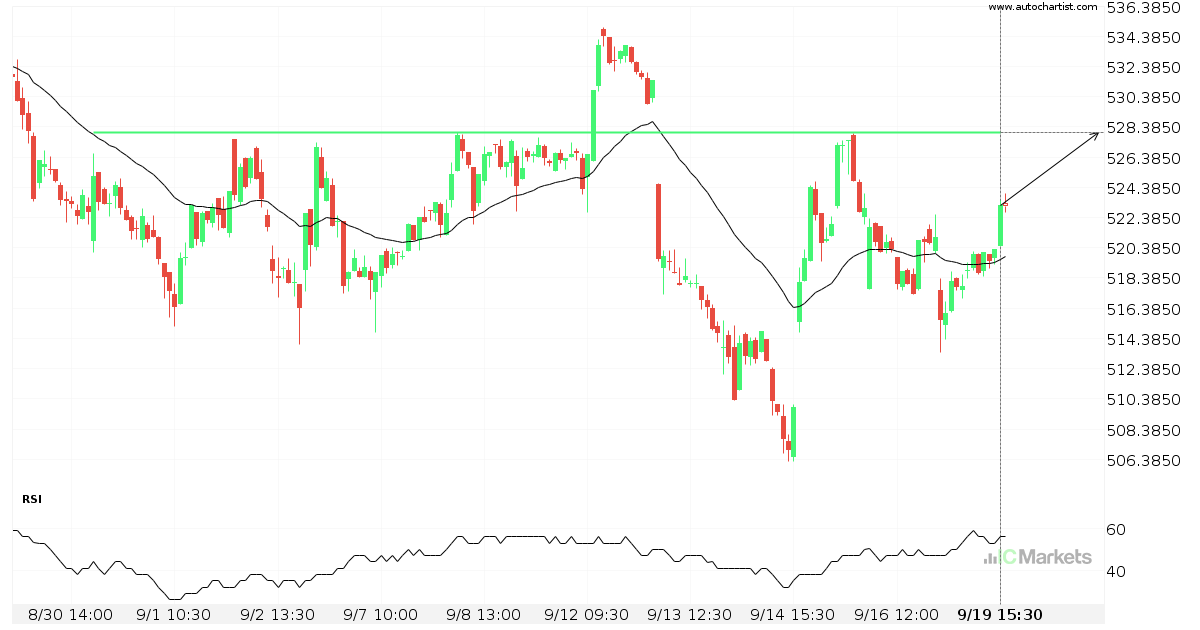
Either a rebound or a breakout imminent on Unitedhealth Group Inc.

Unitedhealth Group Inc. is heading towards a line of 528.0200. If this movement continues, the price of Unitedhealth Group Inc. could test 528.0200 within the next 20 hours. But don’t be so quick to trade, it has tested this line numerous times in the past, so this movement could be short-lived and end up rebounding.

Read more
September 19, 2022North_American_Stocks_ptIC Markets

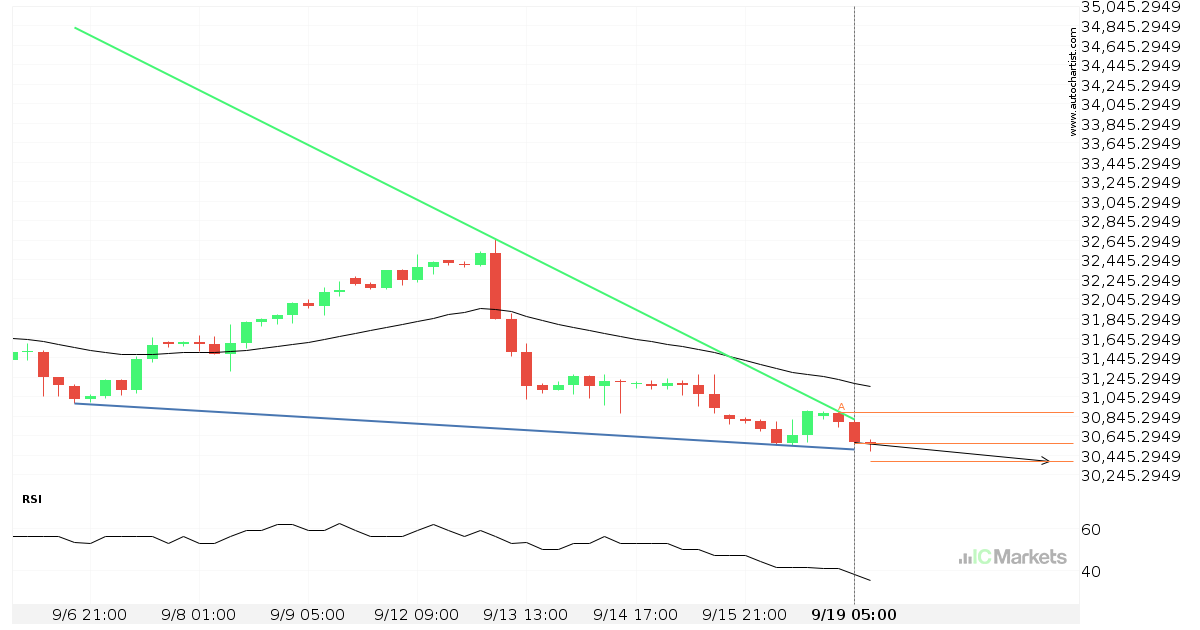
Either a rebound or a breakout imminent on US Wall Street 30 Index

US Wall Street 30 Index is heading towards the support line of a Cunha descendente. If this movement continues, the price of US Wall Street 30 Index could test 30383.2111 within the next 3 days. It has tested this line numerous times in the past, so this movement could be short-lived and end up rebounding […]

Read more
September 16, 2022North_American_Stocks_ptIC Markets

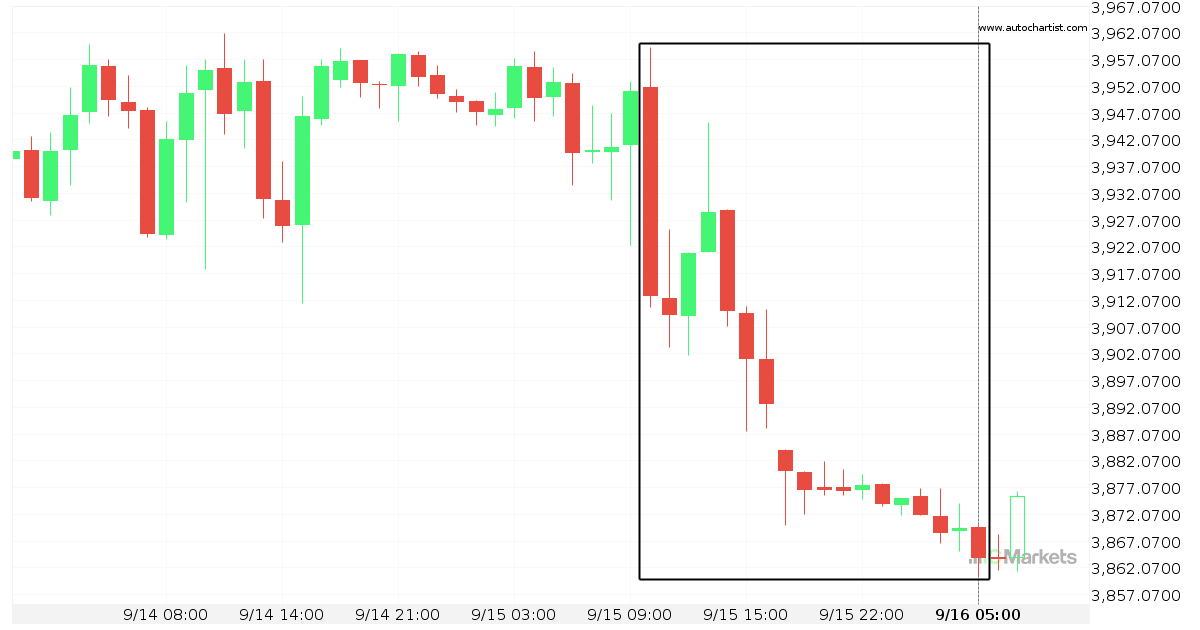
What’s going on with US SPX 500 Index?

Those of you that are trend followers are probably eagerly watching US SPX 500 Index to see if its latest 1,25% move continues. If not, the mean-reversion people out there will be delighted with this exceptionally large 19 hours move.

Read more
September 15, 2022North_American_Stocks_ptIC Markets

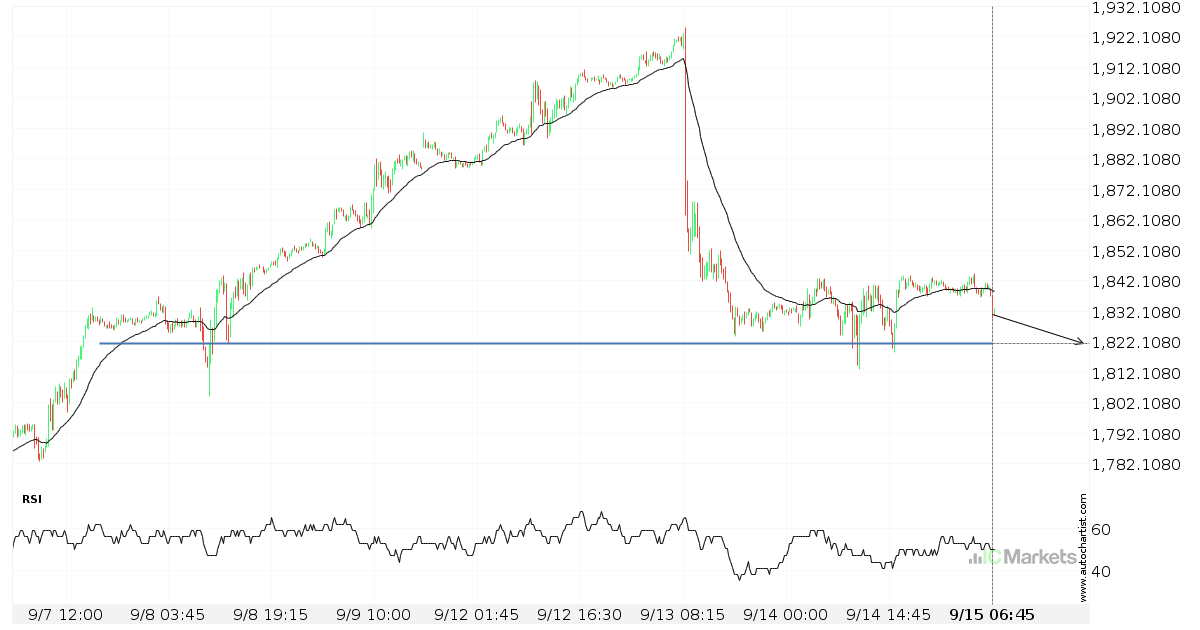
Breach of important price line imminent by US Small Cap 2000 Index

US Small Cap 2000 Index is moving towards a line of 1821.4900 which it has tested numerous times in the past. We have seen it retrace from this position in the past, so at this stage it isn’t clear whether it will breach this price or rebound as it did before. If US Small Cap […]

Read more
September 14, 2022North_American_Stocks_ptIC Markets

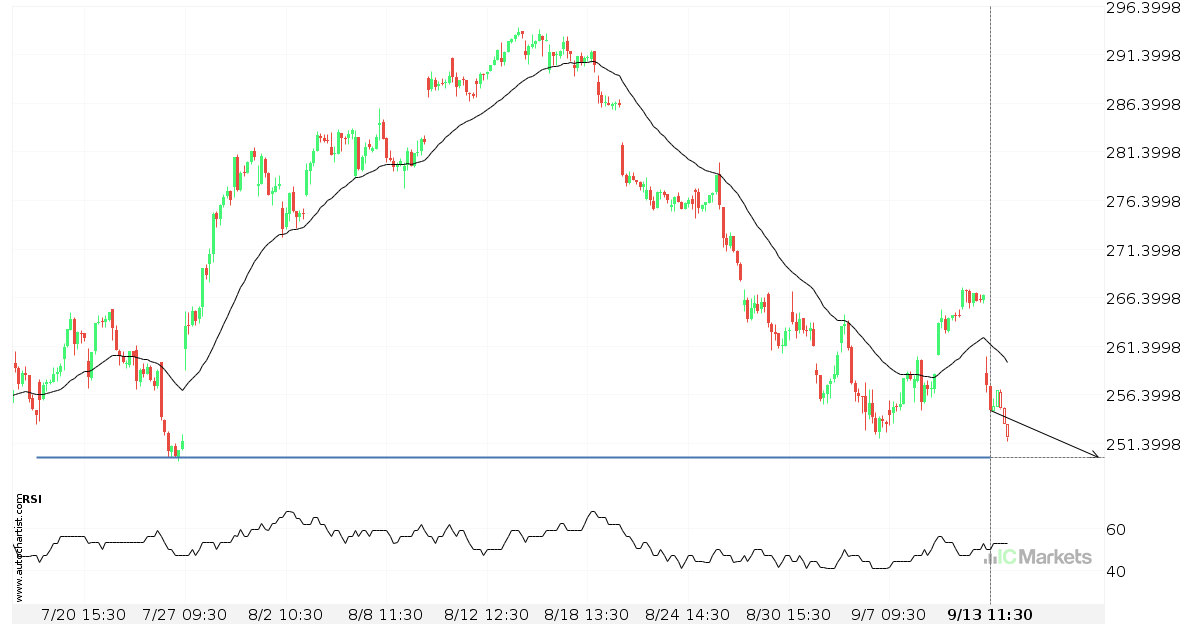
Breach of important price line imminent by Microsoft Corporation

Microsoft Corporation is moving towards a line of 249.9400 which it has tested numerous times in the past. We have seen it retrace from this position in the past, so at this stage it isn’t clear whether it will breach this price or rebound as it did before. If Microsoft Corporation continues in its current […]

Read more
September 12, 2022North_American_Stocks_ptIC Markets

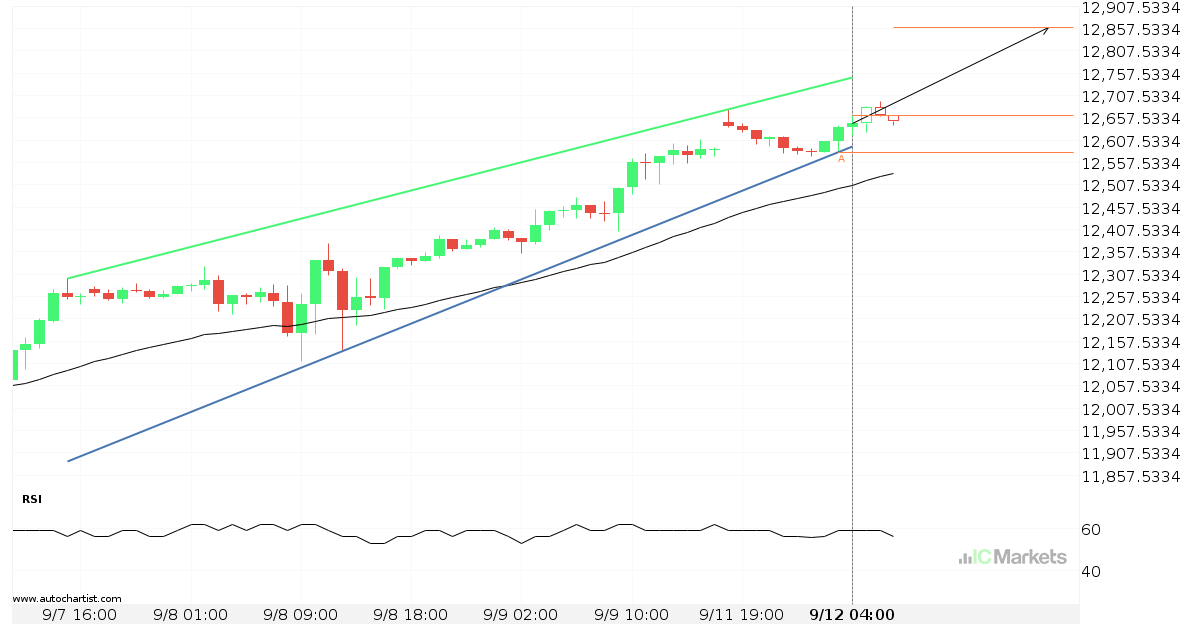
US Tech 100 Index approaching resistance of a Cunha ascendente

US Tech 100 Index is approaching the resistance line of a Cunha ascendente. It has touched this line numerous times in the last 5 days. If it tests this line again, it should do so in the next 15 hours.

Read more
September 9, 2022North_American_Stocks_ptIC Markets

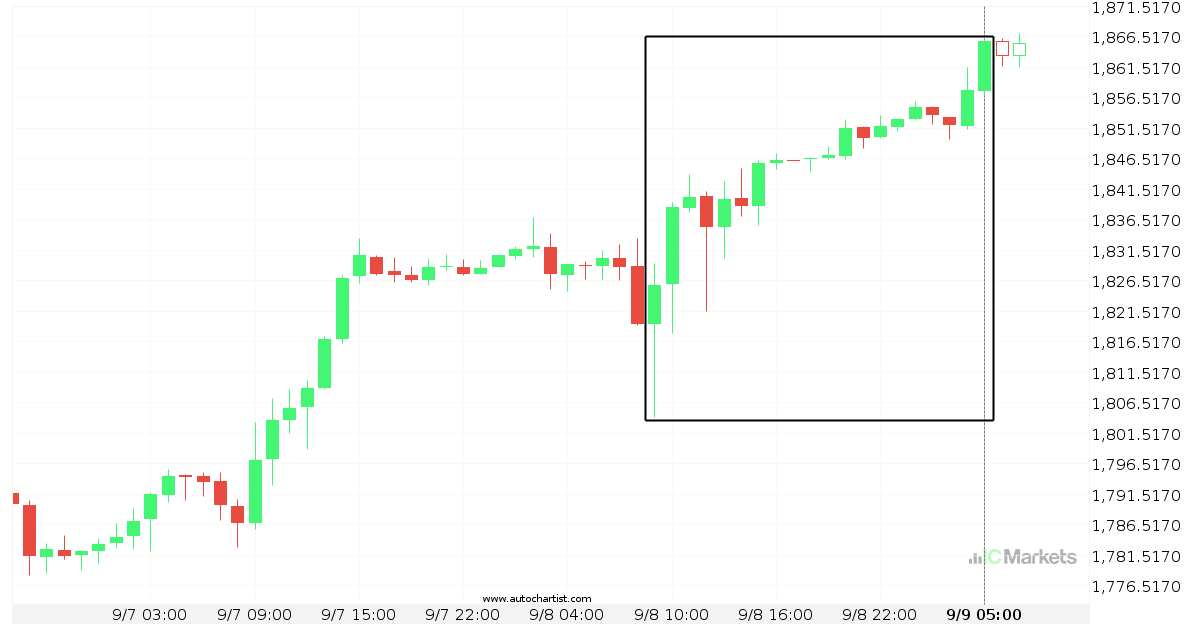
US Small Cap 2000 Index experienced an exceptionally large movement

For those of you that don’t believe in trends, this may be an opportunity to take advantage of an exceptional 2,19% move on US Small Cap 2000 Index. The movement has happened over the last 20 hours. For those trend followers among you, you may think about riding this possible trend.

Read more
September 8, 2022North_American_Stocks_ptIC Markets

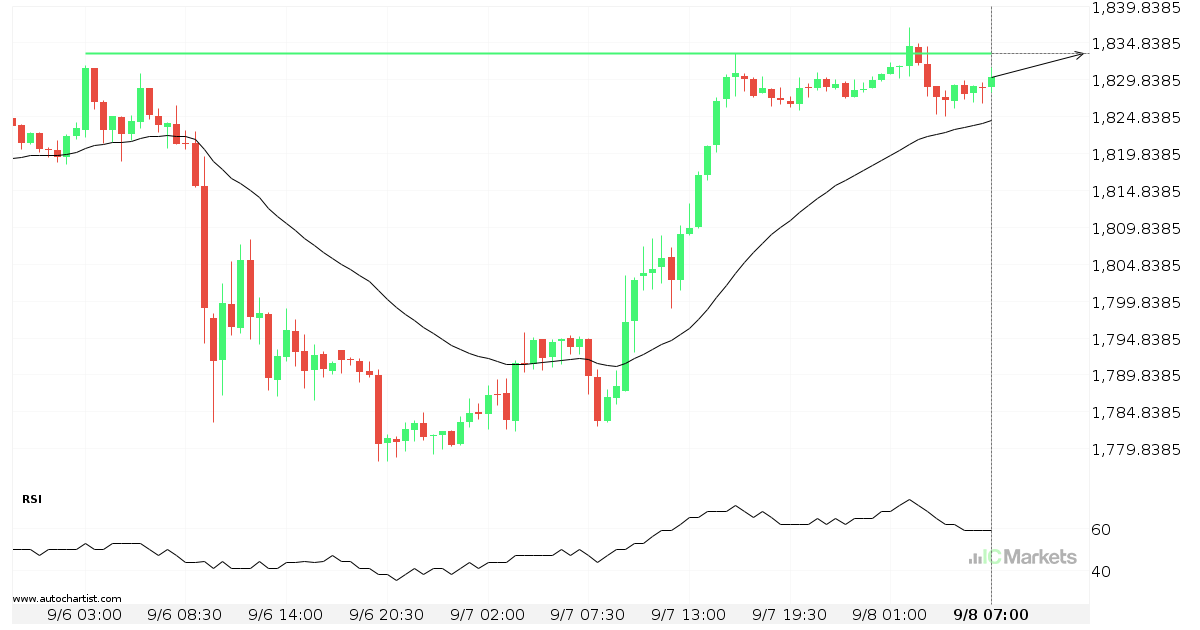
A final push possible on US Small Cap 2000 Index

US Small Cap 2000 Index is heading towards 1833.4301 and could reach this point within the next 12 hours. It has tested this line numerous times in the past, and this time could be no different, ending in a rebound instead of a breakout. If the breakout doesn’t happen, we could see a retracement back […]

Read more
  • 1
  • 2
  • 3
  • …
  • 47
  • 48
  • 49
  • 50
  • 51
  • 52
  • 53
  • …
  • 87
  • 88
  • 89

Recent Posts

  • US Wall Street 30 Index – المستوى الرئيسي – مقاومة
  • Brent Oil vs US Dollar – نموذج الرسم البياني – قناة صاعدة
  • Brent Oil vs US Dollar – نموذج الرسم البياني – قناة صاعدة
  • Hong Kong 50 Index – نموذج الرسم البياني – مثلث صاعد
  • Hong Kong 50 Index – รูปแบบกราฟ – สามเหลี่ยมขาขึ้น

Recent Comments

    Translation


     Edit Translation

    Trade with

    a market leader you can rely on

    Open Trading Account Try a Free Demo

    Forex Trading

    • Accounts Overview
    • Open an Account
    • Launch Web Trader

    Trading Specifications

    • Spreads and Commissions
    • Range of Market
    • Trading Hours
    • Funding
    • Withdrawal

    About IC Markets

    • Help Center
    • Why IC Markets
    • Regulation
    • Legal Documents
    • Contact Us


    Forex Trading

    • Accounts Overview
    • Open an Account
    • Launch Web Trader

    Trading Specifications

    • Spreads and Commissions
    • Range of Market
    • Trading Hours
    • Funding
    • Withdrawal

    About IC Markets

    • Chat with a Specialist 24/7
    • Why IC Markets
    • Regulation
    • Legal Documents
    • Contact Us

    Disclaimer: This material is marketing material where all marketing material is published for informational purposes only. This material does not contain and should not be considered as containing - investment advice and recommendations, or suggestions for performing any actions with financial instruments. The built-in widgets belong to their external independent authors, and IC Markets is not responsible for their content and their impact on trade.

    All content rights reserved. Opinions of the authors may not coincide with the opinion of the blog editors. When copying materials from this site or connecting to an RSS feed to republish our articles, a link to IC Markets or attribution in the format ‘IC Markets Blog’ is required. For general questions, please contact the editorial office via the form on the Contact us page.

    Risk Warning: Trading Derivatives carries a high level of risk to your capital and you should only trade with money you can afford to lose. Trading Derivatives may not be suitable for all investors, so please ensure that you fully understand the risks involved and seek independent advice if necessary. A Product Disclosure Statement (PDS) should be considered before entering into a transaction with us.

    The contents of this page are general information only and does not take into account your personal situation, financial objectives or needs. It is up to you to make sure the products that we offer suit your specific needs. You should not trade with us unless you understand the features and risks of the products that we offer. This means that you might need to seek independent advice before you start trading with us.

    © 2022 Raw Trading Ltd | All rights reserved.
    • Sample Page